Know what your community needs, then act in the right order
For foundations, nonprofits, coalitions, cities and counties that need one shared, evidence-based picture of local conditions before deciding where to invest.
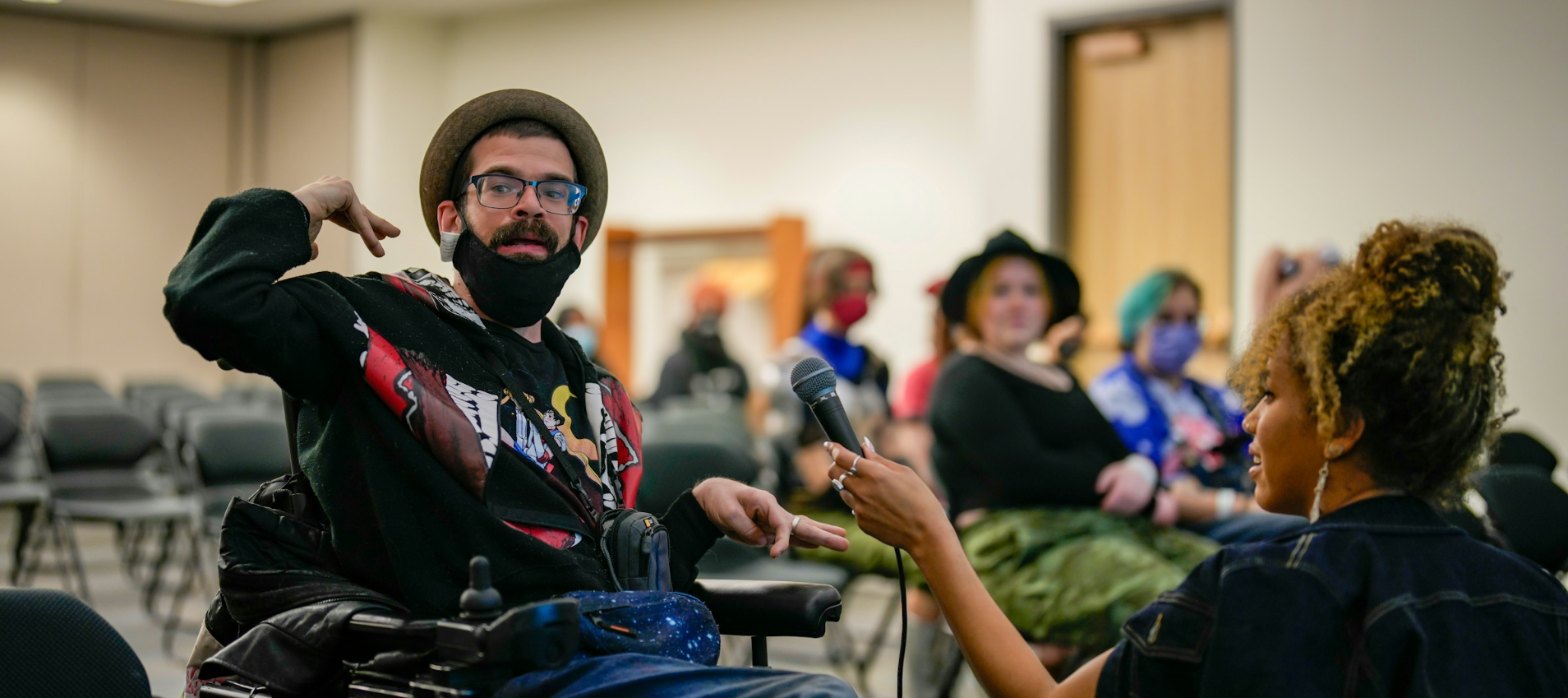
Data alone misses people. Listening alone misses scale.
Many needs assessments end as a stack of charts nobody acts on, or as a set of listening sessions with no way to tell how widespread a concern is. Funders and councils then have to choose priorities on instinct.
This work puts the two together: public data shows how large a problem is and who it affects, and residents explain what it looks like from the inside and what would help.
What makes the approach different
- One common frame. Findings are organized by the eight F.A.M.I.L.I.E.S.™ pillars, so partners in housing, health, schools and jobs read the same map.
- Every number is cited. Each indicator lists its source, year and limits, so the report holds up when it is questioned.
- Gaps are not treated as causes. A disparity is reported as a disparity. Explanations are offered only where the evidence supports them.
- Residents see results first. Findings are taken back to the people who contributed before they go to a board.
How an assessment runs
Five stages. Each ends with something your team can use, even if the work stops there.
- ScopeAgree the questions, the geography and the decisions the findings must inform
- ProfileAssemble public data on the pillars that matter here, with peer comparisons
- ListenResident survey and listening sessions, planned with local partners
- Make senseReview findings with residents and partners and test early conclusions
- PrioritizeA short list of priorities, each with evidence, an owner and a measure
Services and fees
Starting prices and typical ranges. Every engagement is confirmed in a written proposal based on scope, complexity, data availability, deliverables, organization size and implementation needs.
F.A.M.I.L.I.E.S.™ Community Impact Assessment12–16 weeks$25,000–$45,000
Indicator profile across all eight pillars, resident survey, stakeholder sessions, findings report and action plan.
Community Needs Assessment10–12 weeksStarting at $18,000
Public data profile, resident survey, 2–3 listening sessions, findings report and priority list. Final price depends on community size and scope.
Community Strategic Planning12–16 weeks$20,000–$30,000
Data profile, resident and staff input, facilitated planning sessions and a written plan with measures.
Municipal & County Impact Assessment12–16 weeksStarting at $20,000
How a city or county program or investment is reaching residents, with recommendations.
Family Well-Being Assessment8–10 weeksStarting at $12,000
Measures of family stability, health, housing and opportunity for a defined community.
Youth Development Initiative Design6–8 weeksStarting at $8,000
Program model, mentoring structure, partners and outcome measures for youth and young adults.
Housing & Neighborhood Stability Assessment8 weeksStarting at $10,000
Housing cost burden, stability and neighborhood conditions, from public data and resident input.
Community Safety & Violence Prevention Research8 weeksStarting at $10,000
Community-level public safety data and resident perspectives; no individual-level records.
Public Health & Wellness Research Brief3–4 weeksStarting at $4,500
Access, coverage, maternal and child health, mental wellness and chronic disease indicators.
Community Data Dashboard6–10 weeks$10,000–$15,000
A public dashboard of 10–20 indicators with sources, plus $500 a month to keep it current.
Policy Brief & Recommendations3–4 weeksStarting at $4,500
A four-to-six-page brief on one question, from public data, with sources and limits.
Nonprofit Strategy & Cross-Sector Partnerships6–8 weeks$8,000–$12,000
Strategy, partner roles and agreements for nonprofits working across sectors.
What you receive
- A community profile with sources, peer comparisons and data-quality notes
- Survey and listening-session results, reported by theme
- A findings report written for residents, staff and board members
- A priority list ranked by size of need, evidence and feasibility
- A baseline of indicators to track progress, with an optional public dashboard
How progress is measured
Each priority gets a baseline and a target set by your team, not by us.
- Activity
- Was the planned action carried out, and with whom?
- Reach
- How many residents, and which groups, did it reach?
- Conditions
- Did the indicator move, measured against the baseline at the next data release?
Community indicators move slowly and for many reasons. A change is described as an effect of the program only when the design supports that claim.
Who leads the work
Dr. Shunverie M. Rushing built the State of the F.A.M.I.L.I.E.S. research platform, which compares all 50 states across eight pillars of public data with published methods and open data files. She has nearly 20 years of experience designing and evaluating publicly funded programs.
Experience listed is Dr. Rushing's own professional history, not completed Rushing4Success contracts. No former employer endorses this firm.
Read her story →Resident data and safety
- Public-safety and health work uses community-level data only, never individual records.
- Survey and session comments are reported by theme, without names.
- Small groups are suppressed in every table so no one can be identified.
- Findings belong to the client and the community; nothing is published without agreement.
Tell us the decision you are facing
Bring the decision you need to make (for example, where a foundation should focus its next grant cycle) and any data you already have. You will leave knowing whether a full assessment, a shorter brief or a free resource fits.